
| |
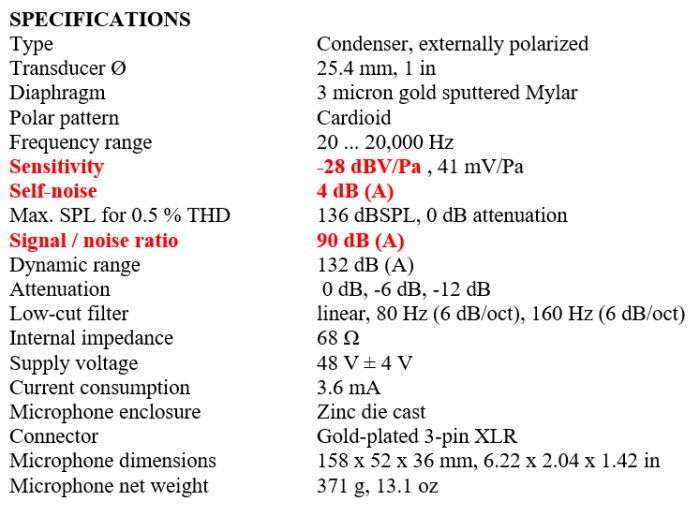
For directional microphone work I have identified two excellent microphones that seem both very sensitive and very low noise as well as highly directional (See Microphone Specification Table p51). The Wildtronics Pro Mono 22" parabolic dish, and the Rode NTG8 (22 in).
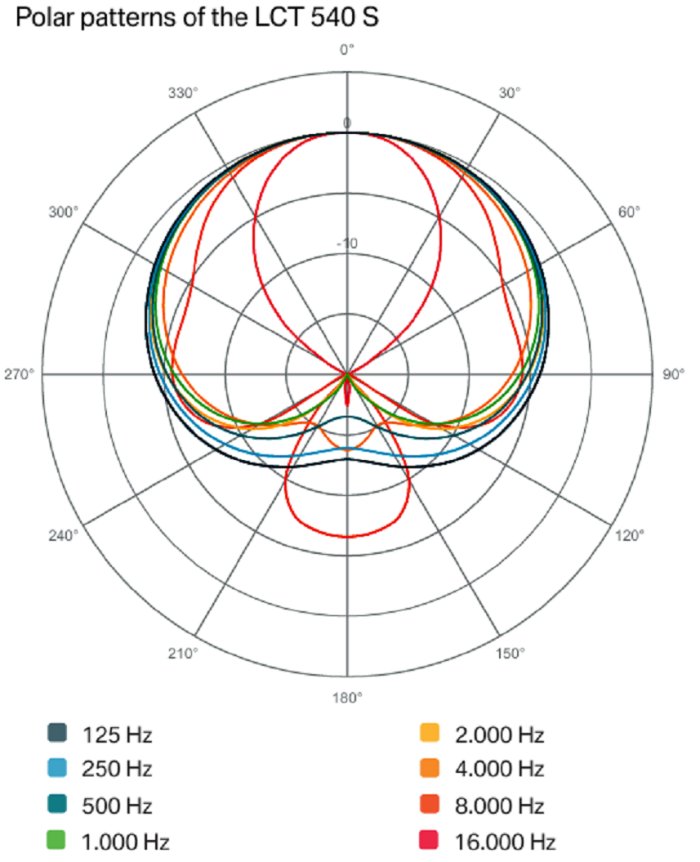
I try to look at and compare the polar plots of the three mics but find it difficult as Wildtronics and Rode have chosen different dB scales. Where Wildtronics places the origin at -40dB and maximum gain at 0dB, Rode places the origin at -25dB with maximum gain of +5dB. This is an excellent example of how companies can make comparison of charts as difficult as possible. In order to get my arms around the problem, I have accepted to go ahead and digitize the respective polar charts of the Wildtronics and Rode microphones. With the polar data in digital format I can recalculate the data to a common base.
Standard polar plotting sets the chart with 0 dB amplitude at 0 degrees azimuth. (Rode is deceptive in altering this, perhaps wanting to "suggest" a forward gain of 5dB, who knows). In my first plot I simply present to curves together in their normalized scales. For Wildtronics I include curves for 1000 Hz and 3150 Hz. For Rode I include their curves at 1000 Hz and 4000 Hz. This gives a first-order comparison of the directionality of the two microphones. It should be apparent that the two mics are rather comparable and each should give satisfactory directionality in the field.
This first-order look does not tell the entire story. The Wildtronics and NTG8 appear fairly similar overall. One thing to note though, unlike the long Rode NTG8, the Wildtronics 22" dish DOES give noise-free gain. From the gain equation (G = 20Log(3.25DE/W) where G = dish gain dB, D = Diameter in inches, W = wavelength in inches, and E = Efficiency from 0 to l). Efficient dish gain is: @ 1000 Hz = 14 dB dish gain, and @ 4000 Hz = 27 dB dish gain. As you will see, the dish is NOT 100% efficient.
For the following plot, I added the sensitivity to the data, shifting the curves to their true relative positions. Thus you can see that each curve intersects the 0 degree line at its respective sensitivity and things change as you get increasingly off-axis. Note that dish gain increases with increasing frequency so that in the relative plot the 3150 Hz curve expands outside the 1000 Hz curve as compared to the original normalized plot above. Due to rescaling the amplitude axis the Wildtronics curves ballon out somewhat although I tried to compensate by plotting the chart origin at -35 dB.
Even though the Wildtronics curve "looks" slightly puffed out, it is unchanged and should be interpreted the same way as before. It should be more straightforward to interpret and compare the off-axis rejection now. Of course in plotting the true sensitivities with this scale, the Rode curves look small and some of their data has been lost in the singularity at the center of the chart. On the other hand it is still a fine solution for use while walking. I cannot imagine trying to carry a 22 inch dish about in the woods! So, which microphone to take depends on your intended use.
KJS 04/2025