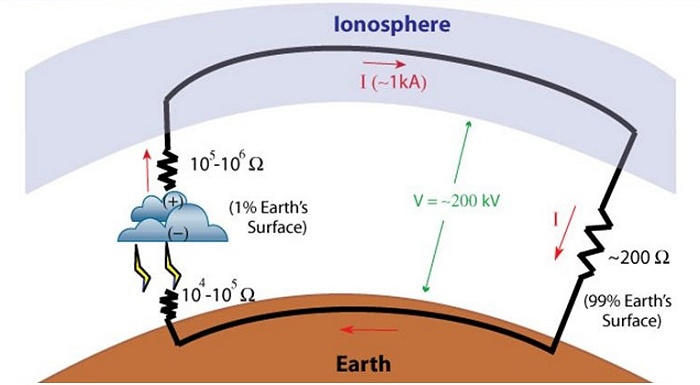

There exists at all times an electrical circuit between the earth and the ionosphere which conducts currents continuously. This circuit, shown in the diagram above, is driven by powerful thunderstorms in the tropics (principally) which drive current into the ionosphere. A "fair weather" return is provided by cosmic ray ionization in the upper atmosphere and conductive ions and aerosols in the lower atmosphere.
My project is to measure changes to these potentials near to the ground. Changes can be caused by various factors including local aerosol concentrations, mixing due to winds, humidity, moisture content (conductivity) in the ground, and variations in the actual current itself. I make 24-hour long runs with the expectation to find diurnal variations as well as the shorter-period variations listed.
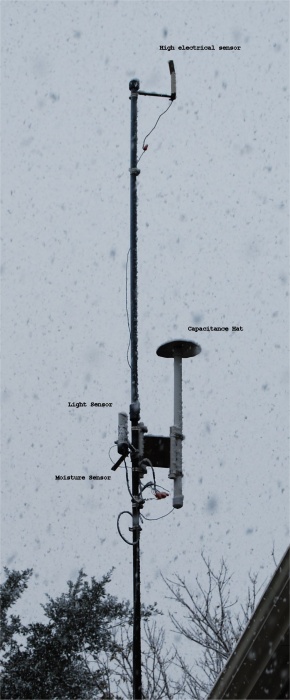
My experimental setup is quite primitive consisting of a four-foot copper ground rod and an electrode "probe" raised to about 15 ft high. The probe itself is a steel carpet-cutting blade with a copper lead soldered to one end. Additionally, to increase its sensitivity (connection to the air as it were) I mixed a solution of epoxy and thorium dust and applied this to each side. The ionizing radiation improves conduction into the air. Between the ground and the probe I attach a logging multimeter to record the static level. This setup works well both as a lightning detector (see next page) and for the fair weather field. I present here data for fair weather conditions with minor storm and rain impacts.
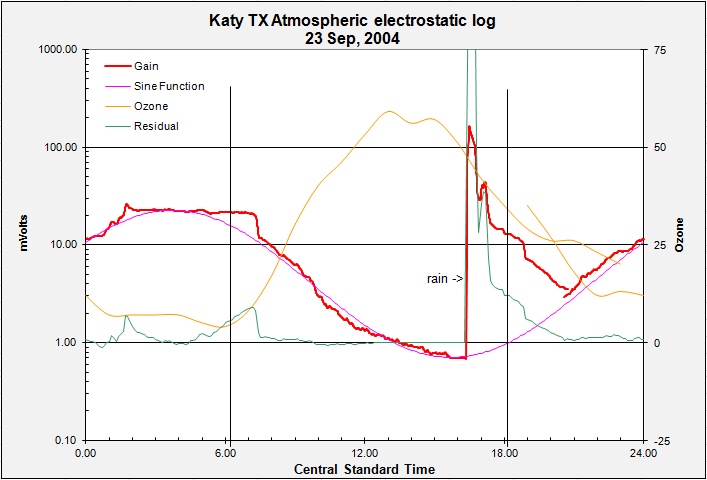
The first plot I wish to present (above) shows some interesting aspects of the field. First let me explain the chart itself. I plot in bold red the field gain read by the multimeter, output in mV and note that I have used a logarithmic scale. In light orange I plot the local ozone concentration from a nearby NOAA station. The ozone concentration gives me an idea of the local aerosol concentrations. In pink I show a sine-wave model of the diurnal field variation. I was most fascinated by the lovely sine form of the "base" field in my readings. In green I plot the residual difference between the model sine wave and the actual field. Finally, I also show the sunrise and sunset as vertical lines.
The day presented, 23 Sep, 2004, has a very nice sine response with an afternoon shower, rain off and on for about an hour. The rain immediately alters the conductivity at ground, the fresh water acting like a resistor increasing the voltage readings (Ohms Law I = V/R, or for this case V=I*R). I have a sensitive rain sensor! Note also the residual anomalies around sunrise or just prior. This anomaly became a principal goal to measure in this project.
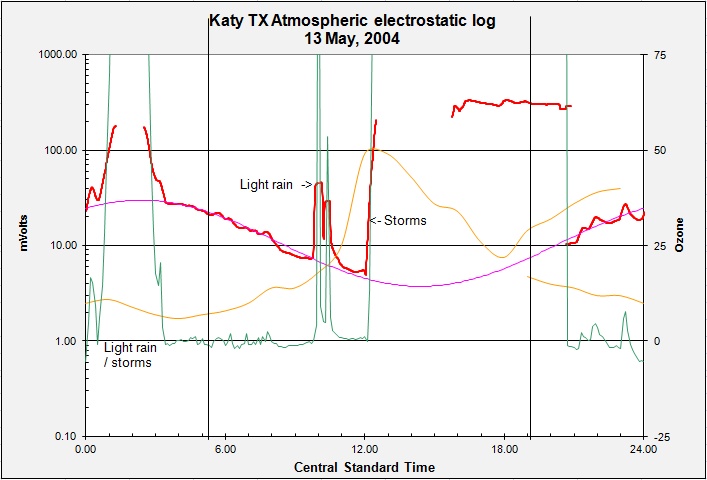
On 13 May, 2004 the weather was more stormy with rain/storm conditions between one and two in the morning (CST) and later again through much of the afternoon. The ground remained saturated until the end of the day's run. Despite this the sinusoidal nature of the fair weather field still shows well, although with a lesser amplitude than previous.
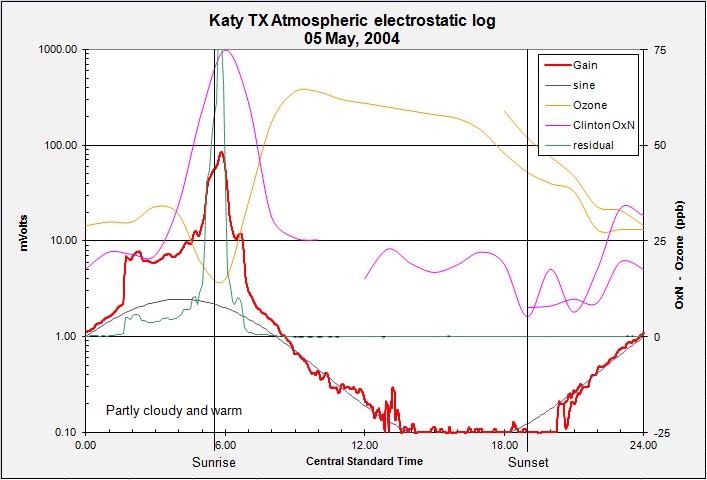
The third plot above shows a rain-free day, partly cloudy and warm. Good sinusoidal field response but here note the strong positive residual anomaly around sunrise. The "sunrise effect" has been noted in many studies and has been attributed to early morning mixing and rising air at sunrise. The rising air carries charged aerosols upward increasing the charge potential until later mixing restores the fair weather field. In my plot note the correspondence of a minima in the Ozone and a spike in the OxN concentration. Things are happening.
The Fair Weather Field is facinating, but storms are the battery, next.