The shallow crust and surface of the earth host interesting natural electric currents. These "Telluric" currents have been, and remain, a source of much wild speculation and interest as well as scientific study. I challenge you to go Google "telluric" and I guess most of what you will find is spooky nonsense, wild ravings, and conspiracy theories. This page is concerned with an attempt at a scientific look at telluric currents.
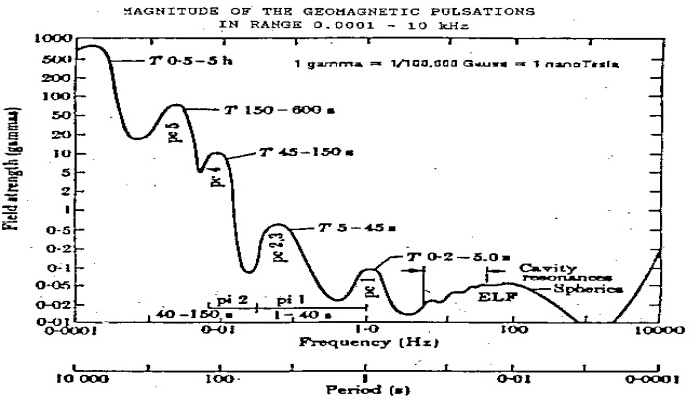
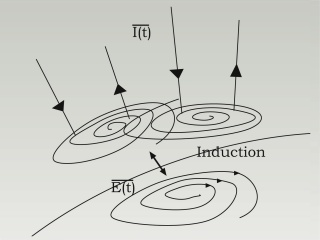
Telluric currents in the earth result from changes in the geomagnetic field which in turn induces currents in the earth, when then set up magnetic fields which induce currents in.. Telluric currents are induced currents and as such their variations can mimic variations in the earth's magnetic fiend. The chart above is an example of short-period geomagnetic variations called pulsations. Similar pulsations can be recorded in telluric surveys and this was a principal goal of my experiment.
My setup consists of four copper ground rods, two about 100ft apart in a NS axis and two also about 100ft apart along an EW axis. I simply hooked up an AD interface to each set and recorded the potential difference for each axis. No other electronics and circuitry were involved, which may account for much of the trouble, eventually burning out the AD interface. As in many of my readings, I read the interface many times a second and sampled every few minutes in order to beat down noise.
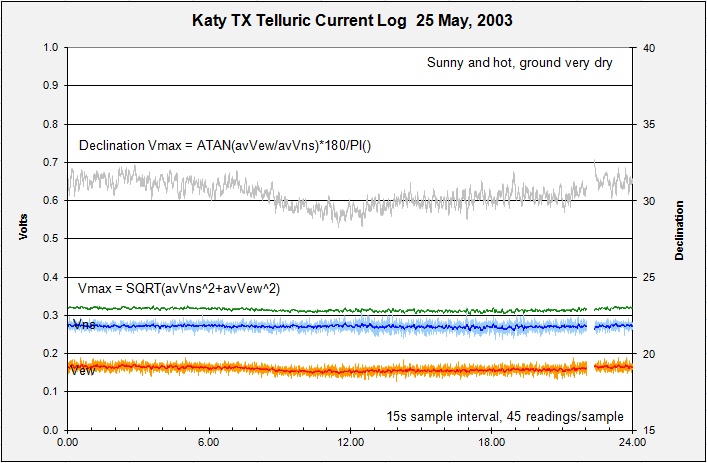
The chart above is a record from 25 May, 2003. I plot the NW and EW potentials and calculate two additional parameters, Vmax and Declination Vmax. I had also hoped to note changes in declination and magnitude as storms approached, but it turned out that the setup is highly sensitive to moisture and the rains associated with storms obliterated any signal. The declination Dmax though does appear to resemble a solar quiet response. I was not able to get enough consistency to determine to my satisfaction whether this is indeed the case.
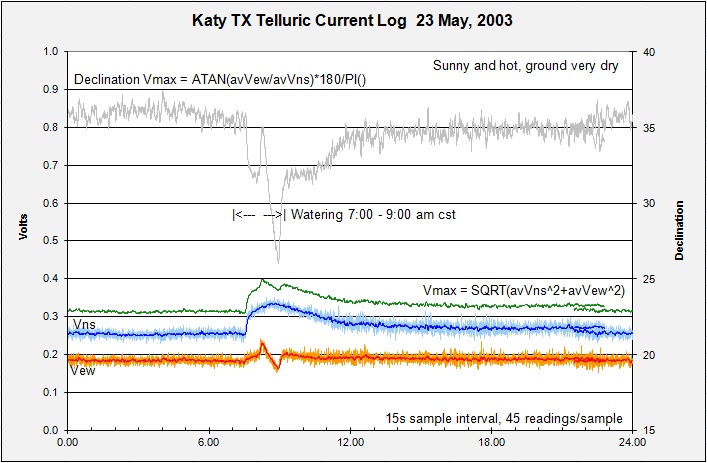
From two days prior to the above chart, now 24 May, 2003 the climate conditions were essentially similar, but in this record the sprinkler system ran from just after 7:00 to 9:00 am. This application of fresh water to the surface caused a dramatic anomaly to the data. With rain the charts became uninterpretable. In all, I feel this project suffered from a severe lack of good engineering ideas on how to set up a proper survey, or how to take the measurements. I did appear to manage a good watering indicator though...
Thank you for visiting my geophysical project pages.