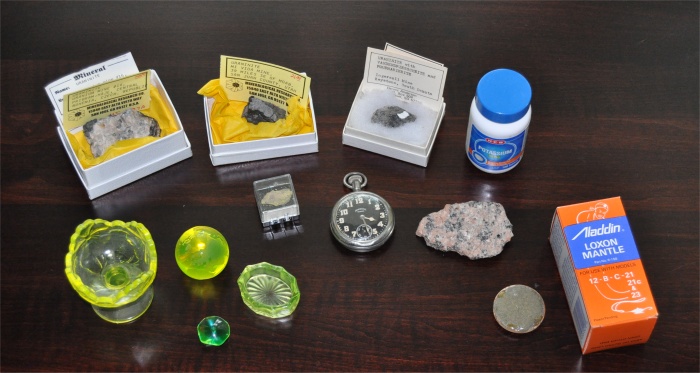
The following photo gives a look at the various sources I have acquired in order to measure and play with. Clockwise from the upper left I have three Uraninite samples, a small Carnotite sample in a plastic box in front of them, a bottle of Potassium supplements, in front of that a chunk of pink granite from Brittany in France, in the center an old pocket watch (made 12-1917) with a "radiolite" dial activated with Radium, on the right a thoriated lantern mantle and next to that a disk where I had burned a mantle and mixed the ash with epoxy, finally back to the lower left several "vaseline glass" objects, a small salt dip, a world paperweight, and compote bowl, and a vaseline bead that came with the Geiger counter, at an added cost. All in all a nice and interesting variety of material with which to make experiments.
Note that, despite all the variety, we are essentially dealing with four radioactive elements, Uranium, Thorium, Potassium, and Radium. All these elements are naturally-occurring in the earths' crust in more or less abundance except the Radium which required significant processing to concentrate. Back in 1917 there were no reactors to produce additional and exotic elements.
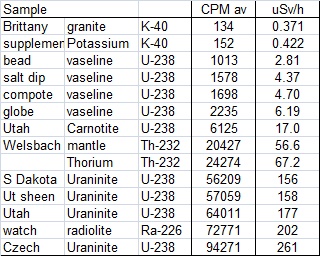
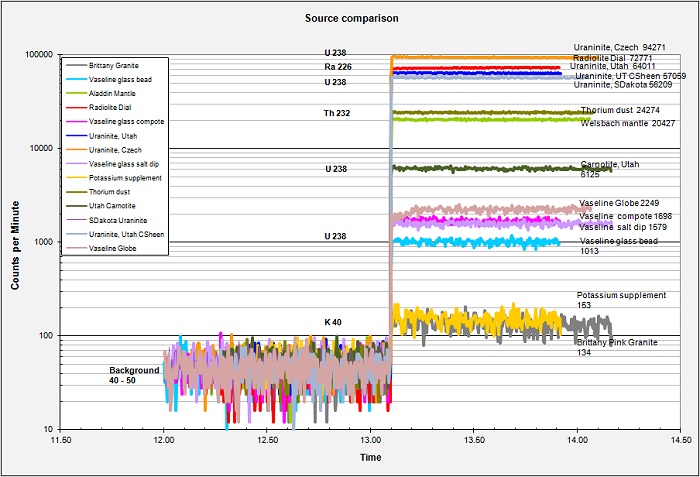
The chart below shows my characterization of each object. To make the measurements, I constructed a stand which held the material about 3/8 inch above the counter. The counter has an opening 2 inches (5cm) across larger than most of the samples. With each measurement I began by taking a background reading for some time and then placing the sample on the stand, collecting data with a one-minute integration, for a half hour or so. In order to produce the chart I adjusted the start times such that the change from background to sample occurred at the same X-axis location on the chart. The table at left shows the same thing much more simply, but not nearly as pretty. Note that I did include the CPM counts converted to uSv/h based on the manufactres Co-60 calibration. I suspect that these values are higher than what may be actually expected for Uranium or Thorium, but it seems important to include this here. These "hot" samples can give dangerously high doses if used, or stored, in close proximity to where you work. Radiation is not a game, be careful!
Other than the Potassium sources being just barely above background, there is no pattern of activity by element. This is because the radioactive elements occur in very different concentrations from sample to sample. It is apparent that the vaseline bead the counter company supplied is pretty lean. The Uraninite mineral samples and the old Radium watch are very "hot" indeed. Not a good idea to store these too close to where you spend much time. No wonder their presence led to a noticeable increase in the local background level.
From a "look-see" standpoint, this is about all that can be done here. You should notice on the chart though that the CPM (Y-axis) scale is logarithmic. The random scatter on each sample is similar but with the increasingly hot high-CPM samples, the scatter becomes smaller with respect to the average count levels. If precision can be thought of as amount of variance compared to the overall signal, then with the same variance imposed on increasing average counts means that the precision is greater at high levels. This is not strictly correct, but good enough. I can barely distinguish the two Potassium samples (at one-minute integrations) with about 30 CPM separating them. But, a 30 CPM separation at high count levels would be equally indistinguishable.
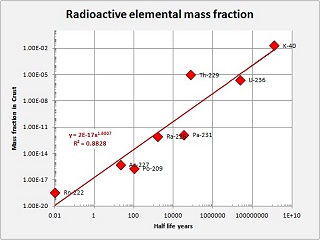
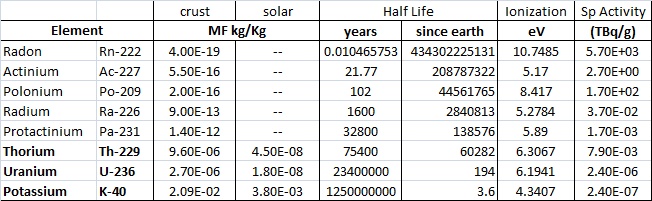
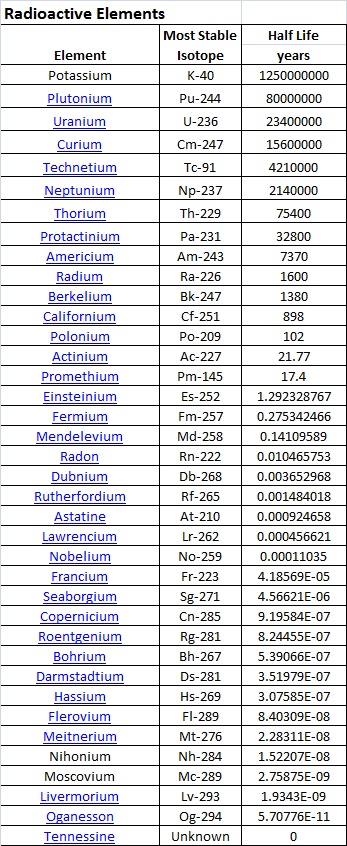
Why only these three or four elements? There are some thirty-seven or thirty-eight radioactive elements on the periodic table, so why these only? The answer has to do with several factors including 1) the half-life of the radioactive element, 2) the age of the Earth (4.55 billion years, (any flat-earthers may kindly leave the room now)), 3) the primordial elemental abundances in the solar nebula which condensed into our solar system, and other factors I am sure. The large majority of radioactive elements are highly active with fairly short half-lives, from milliseconds to hours to a few years. Over the 4.55 billion years of earths' existence there is simply too little left to be measureable. The exotic highly radioactive materials used in nuclear laboratories are all manufactured in reactors. Only the relatively low-activity elements with very long half lives remain in any quantity. Looking at the small chart at the upper-right of this page I have plotted the crustal Mass-Fraction of the eight top elements versus their half-lives. One can see that longer half-lives are clearly correlated with higher mass-fractions. Thorium sits a bit above the curve and I suspect that it may have started with a higher nebular abundance... Maybe..
The table below lists eight elements for which the Mass Fraction (MF) in the earth is even "estimatable". Of these, only the last five are minable and/or concentratable. OK, I do not know what the heck Protactinium is or why it is on the list, seems to be a fair amount but it has never been mined and concentrated to my knowledge. That leaves only Radium (needing a lot of laboratory concentration), Uranium, Thorium, and Potassium. The half life of potassium is SO LARGE that it is barely radioactive at all. Radon is included on the list even though it is a) a gas and b) barely in measureable quantities in the earth. The Radon we deal with is not primordial Radon, but rather the daughter product of the ongoing decay chains of Uranium and Thorium. Actinium and Polonium are more easily manufactured than mined, ditto for Radium now I imagine.
So, if you wish to acquire radioactive sources to measure, you are pretty much stuck with Potassium, Thorium, and Uranium. Radium can be found occasionally in antique shops as clock/watch or instrument dial paint. It is possible to purchase stronger elements in some cases but this is not recommended. The reason we mine Uranium is that it is, in the grand scheme of things, not really very radioactive. Still, it is already dangerous enough. Do not start pushing your luck!
The chart below is another that lists all the radioactive elements. The short half-lives of most are evident.
The following section takes a look at an absorption experiment and what it can reveal about the sample radiation.