Seasonal Variations
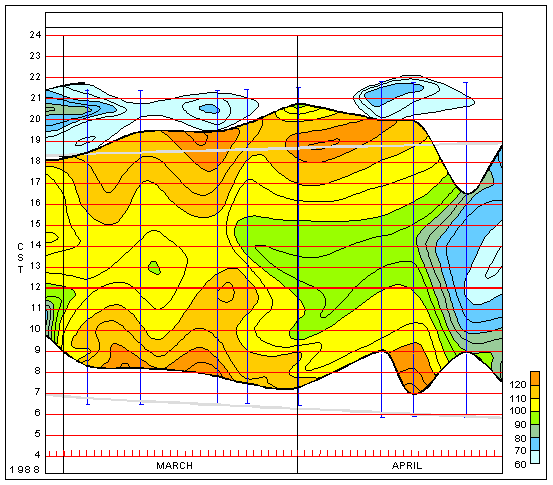
The record presented in the previous section represented a nearly "ideal" winter record. I found that winter openings were generally dependable with a distinct jumps in the morning and drop in the evening, and good strong reception all day. 06 October, 1989 was another good day. It is possible to "map" the data from week to week in order to visualize how the propagation openings change with time. The following chart shows a map of signal strength contoured against time. Local Central Standard Time is on the Y-axis and calendar time on the X-axis. Each day starts at the bottom and moves up, the next day starting again at the bottom next to (to the right of) the prior one so the calendar flows to the right. Additionally, the Gray curves running along the upper and lower portions of the map indicate local Houston sunrise and sunset respectively.

This map shows the period of March and April, 1988. In it you see the srong morning and evening signal (in browns) and the midday sag in yellow to green. On the right the signal for the record of 22 April becomes poor, (blues). This was an active day with geomagnetic disturbances disrupting the propagation. Also in this map you can see typical evening sporadic low-level propagation after the main opening has ended, especially in early March.
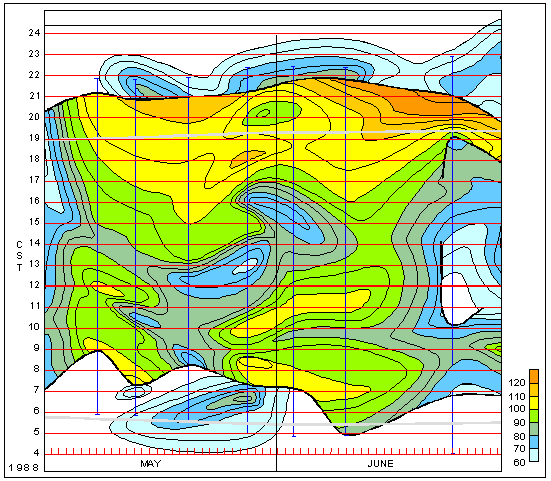
In contrast to the above "winter" view, the following map shows the doldrums of summer. It is for the period of May and June, 1988. I characterize the propagation in summer as generally longer duration, but with lower signal strength and much greater day to day variability. It is not unusual to have a good strong opening for an hour or two in the evening, but generally the records are choppy and noisy, fading is a far bigger problem.

On 24 June of this period there occured a major flare at 1609UT (1009CST) which closed the window for several hours.

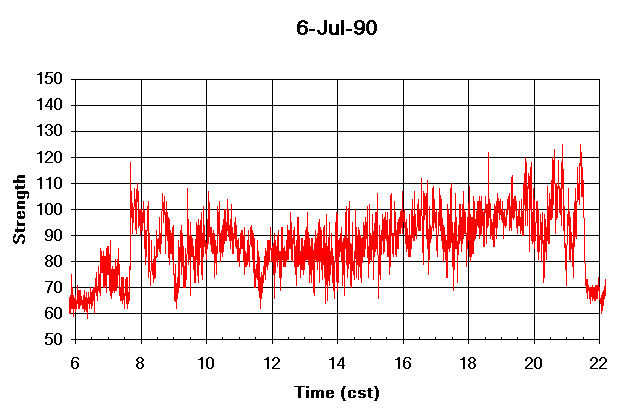
This chart shows a fairly typical (if there is such a thing) "summer" record taken on 06 July, 1990. The day had strong solar flux at 209, and the geomagnetic field was moderately quiet. Still, the signal was weak most of the day with lots of noise and levels only in the S3 - S5 (80 - 90) range. A week later on 13 July the opening made a brief appearance in the morning and then headed south all day. Good day to go fishing.
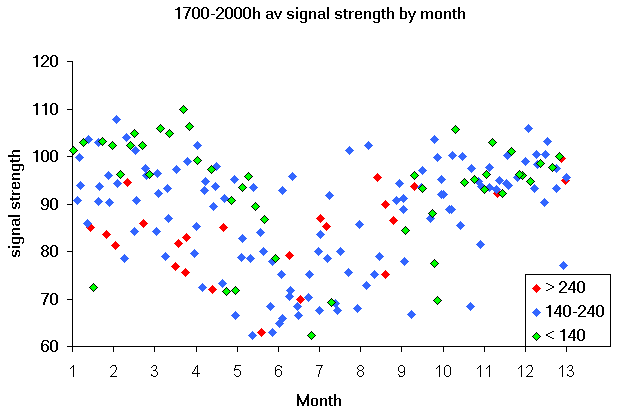
I have taken averaged hourly signal strengths for all 200 records and put them on a spreadsheet to make further analyses. The following graph shows the average strength for the midday period 1700 - 2000 UT (10am to 1pm CST) averaged together and plotted by month. That is, all february data regardless of year together, all June and so forth. Although some years may be better overall, you can clearly see the seasonal signature with good autumn to spring signal and poor summer reception.

The following section shows the signature of a solar flare since finally, thats what all this is about!
Next: Flare responce..
Return to contents..
Go back....


