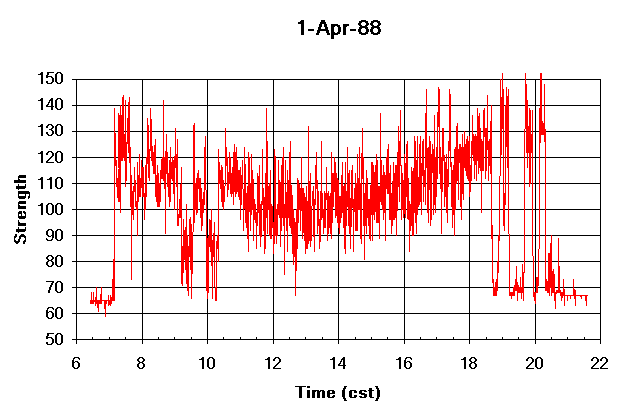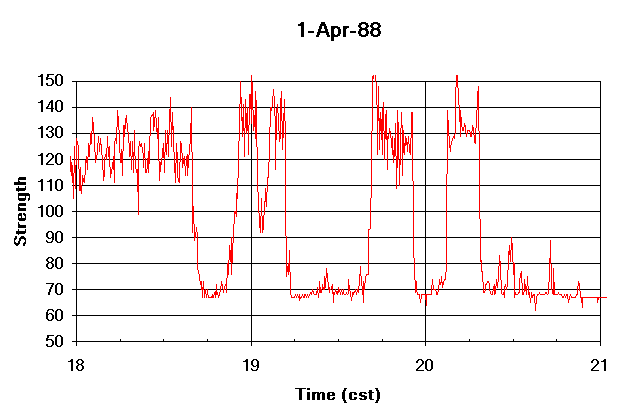

The above view focuses in on 18 to 21 CST showing more detail in the features. They clearly represent moments where the ionoshpere electron density is passing repeatedly through the critical density for propagation. These features show a sinusoidal variation in electron density with a period between 25 and 30 minutes, (from drop to drop). I interpret the variations as density waves propagating in the ionosphere. A test of this would require one or preferable two other beakons being monitored at a close frequency to see whether the same features appear offset in time. Note also on the first chart that there are two signal loss periods between 9 and 11 CST as well, more evidence of unsettled conditions in the F layer that day.