Part I: Diode Test and Protocol
Back to Lab..
The following explains my first attempt to compare a measured diode characteristics with calculated plots based on the Shockley Equation.
I have been taking a serious look into diode modeling and measurement recently in an attempt to better understand these solid-state successors to the humble crystal and cat's whisker detector. There is much good information on diodes to be found in many excellent web sites of course, but there is nothing quite like actually making the measurements and working with them to get a good feel. This page reports some of my protocols and test setups which I have found to be useful.
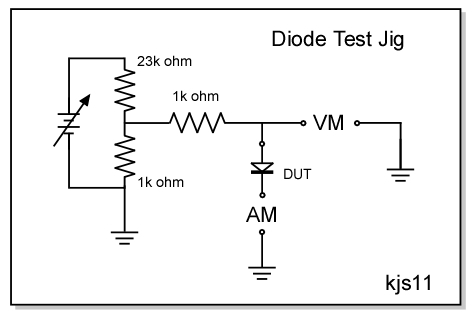
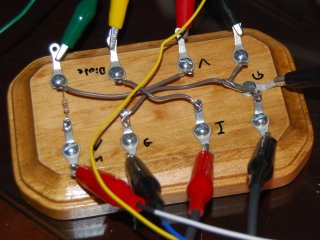
This is a very simple circuit allowing power input, attaching a diode for testing, and sampling both the curent and voltage across the diode under test, (DUT). I made a simple modification by adding a voltage divider, about 20:1 at the power input. The power supply can be connected either at the front across the divider, or after the divider in front of the 100k current limiting resistor for higher voltage readings. I get the input voltage from a modest 18V, 2A regulated DC power supply. This unit has both volt and amp controls with digital readouts, nice to use and doesn’t take up much room on my desk. Here is a case where I recommend you look at getting a new unit. I looked long and hard on ebay, but found few bargins and few units with the same features. Still, the supply regulator was never designed to adjust the output to precise small values making it somewhat difficult/tedious to adjust. Adding a small rheostat to the test jig may aid for making fine adjustments on the voltage. Another piece of equipment you will need for this test is an amp meter. At first I used a nice small digital meter I found new on ebay for $15 shipping included. It reads amps to a lowest range of 200uA, more than enough precision for the task. For that price get two. Later as I got to making more precision measurements for the determination of diode n and Is I acquired a Keithley 195A bench volt/amp meter with very high input impedance. The DVM is, of course, my trusty Keithley workhorse.
I have received occasional criticism for the simple test jig with the suggestion that proper measurements cannot be taken with the jig as-is. I note that, while the test setup is simple, the instrumentation is high quality and performs the job well. I have had the opportunity to collaborate with Mike Tuggle, comparing our respective measurements. Even my early characteristic curves taken with the small amp meter compare well and provide a good view of the diode and determination of the diode Rs series resistance. The detail n and Is measurements presented here essentially match, though at somewhat less precision, those data from Mike. The reader should have some assurance that the data and measurements found on this page are vetted and reliable.
Easy protocol as follows:
1) Set up the test with the diode and meters clipped to the jig.
2) Adjust the power supply until the reading on the DVM meter is where you plan to measure. Adjust the voltage (DVM readout) in steps from 0 to 1.0 Volt in 0.1 V increments and record the current (Amps) in a spreadsheet.
3) Repeat at each tenth volt recording while the spreadsheet makes a sweet graph.
With this protocol you get a good look at the diode Current to Voltage (I/V) Characteristic out to about 1.5 V or slightly higher, well into the region where series resistance dominates the curve. This curve unfortunately does not communicate much about how well the diode will perform under small signal reception with a crystal radio. For this kind of information one needs to push the simple test jig described above somewhat further, down to low voltage / low current regions where DX level signals predominate. To understand your diode and to better match your diode with the set, the needed information concerns the diode resistance at the zero-crossing point, Ro, or Rd depending on the source of information you are using. The value of Ro cannot be measured directly but may be calculated from I/V measurements at very low currents.
Most probably the single best web article for the measurement of diode Is and n parameters is given by Ben Tongue in his Article 16. In this article he describes an interesting circuit for the measurement as well as protocols for making them. For my purposes I did not wish to make this a construction project and felt I might get along with good quality meters and my already-built "Diode Test Jig". Essentially Ben Tongue's method consists of making two precision measurements of Voltage and Current through a diode at small signal levels, essentially about 3 and 6 times Is (sufficiently low that the voltage drop across the series resistance Ro can be ignored). The measurements are then substituted into the Shockley equation If = Is*{exp[(qe/(n*k*T))*(V-I*Rs)]-1} and solved simultaneously for the two data pairs. Mike Tuggle has provided a nice excel spreadsheet to do the math. This spreadsheet, Cal_n_Is.xls forms the basis of my technique and I am thus indebted to both Ben Tongue and Mike Tuggle for making this project feasable.
In addition to simply calculating the main parameters Is and n, I also wished to measure enough points to plot a characteristic curve, and to compare the measured curve with one calculated directly from the Shockley equation. My first spreadsheet then combined Tongue/Tuggle calculation protocol and a graphical view of the match between measured and theoretical. I did make a few methodology modifications which I thought/hoped would allow added accuracy:
1) Using the full Shockly equation without simplifying for an assumed 25dC room temperature. While the 25dC assumption is generally good and probably within the measurement error (or perhaps not), including the actual measured temperature eliminates doubts of inaccuracies due to this parameter. With the power of PC's and spreadsheets there is no reason simplify the equation.
2) Used Vd = 0.04 and 0.05 V (adequately close to Ben Tongue's recommended 0.039 and 0.055 V) whenever possible. Note for some diodes with significantly different forward voltage drops, Si diodes in particular I had to use higher values for Vd.
3) Reporting: I decided that, as there is no unique solution to n and Is, each is dependent on the values Vd and Id, I feel that reporting both Vd and Id is necessary for repeatability. Naturally I also include the ambient temperature in the report as well, and
4) I included a calculation for Ro (or Rg if you are using Tongue's reference) as that is the goal of the exercise.
A screen shot shown below:
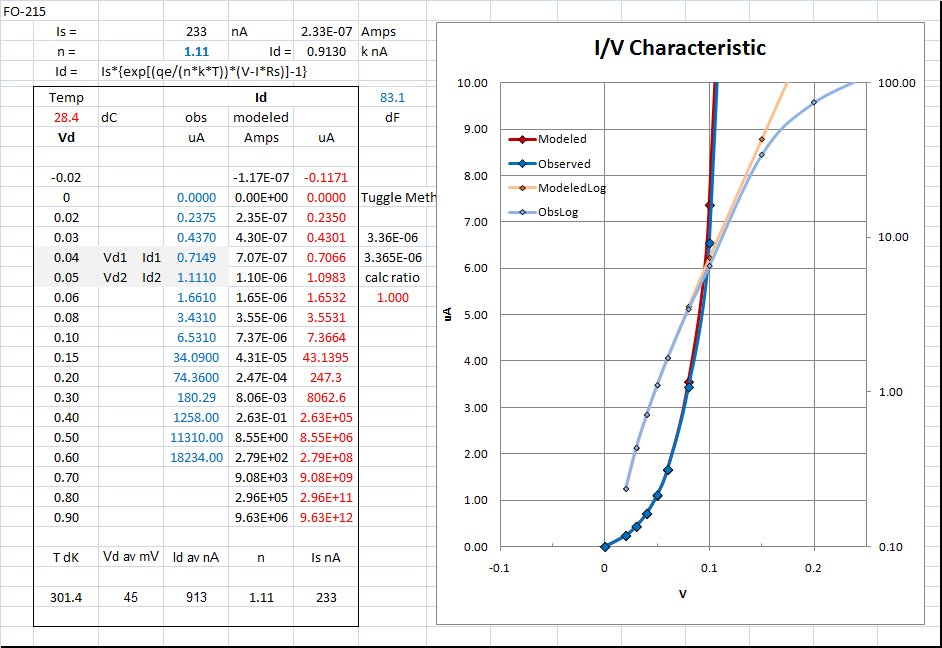
To use the sheet one need only adjust the voltage Vd to that shown in the first column and record the current Id. If only Vd1/Vd2 and Id1/Id2 are measured then the next step is to adjust the value for "n" until the match between the two equations is exact. I even provided a simple ratio calculation to easily test for a match.
While the math is good and results excellent, I quickly found a couple deficiencies in my method,
1) measurements require high precision and its nearly impossible to land EXACTLY at the voltage required. I needed only to get quite close, let the meters stabilize for 2 - 5 minutes, and then record BOTH Vd and Id.
2) the work is rather tedious and, for a large number of diodes it pays dividends to measure only the needed Vd and Id and let the plot aside. My second spreadsheet thus dispenses with the plot. It is with my second spreadsheet that all my data tables and results are posted.
3) better comparisons between diodes can be made if one targets specific Currents rather than Voltages, discussion on this below.
A view of my current data reporting spreadsheet showing ALL input parameters as well as determined values of n, Is, and Ro.
Data input fields in blue: (target Id1 close to 1.0 uA and Id2 close to 0.5 uA).
Calculated fields in red and black.
Adjustment field "n" in green: (adjust value of n until the ratio of the two calculations = exactly 1).

(Note: the engineers in the crowd will have noticed in the above report than I am carrying a degree of precision not justified by the level of accuracy in my measurements. The final results of n, Is, and Ro should be rounded off to not more than three significant figures.)
A copy of my spreadsheet can be downloaded here: Cal_n_Is_Rd.xls
While measuring a good number of diodes, both Germanium, Schottky, Silicon, and even a few LED's, I noted that Tongue's recommended measurements at Vd = 0.039 and 0.055 V resulted in current reports spread out over more than two orders of magnitude. As the determination of Is and n is not unique but a function of Id, I felt uneasy by this method. While most Germanium diodes I have measured have a fairly narrow range of Forward Voltage drops, (Vf), that of Schottky's can range up to a tenth of a volt. This is the factor responsible for the huge range of measured Id values, see the following plot of I/V characteristics for some selected diodes:
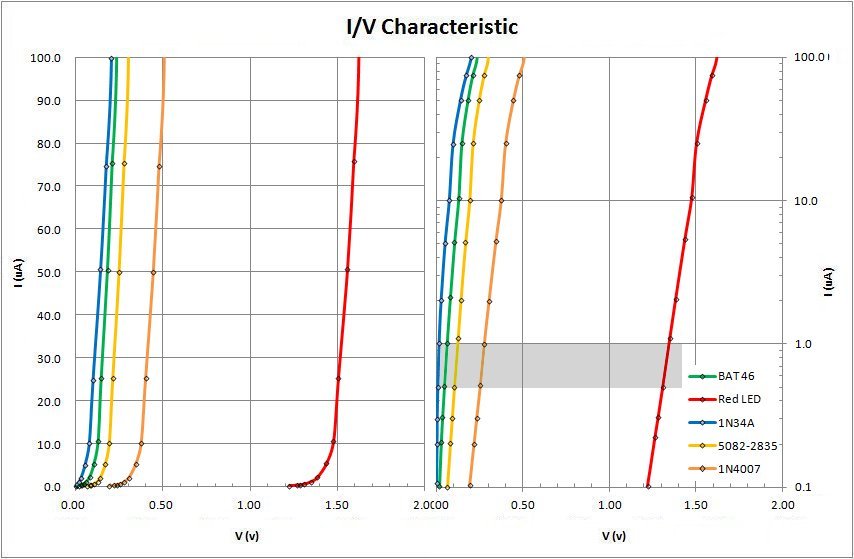
In order to get what I feel is a better comparison between diodes, I have decided to target not some pre-determined voltage, but rather target currents of Id = 0.5 and 1.0 uA. On the above plot on the right (with Log Id vs Vd scale) it will be clear that I am aiming at the same part of the characteristic curve regardless of Vf. Hopefully this will allow good comparison between diodes with rather different Vf, even as far as including Silicon and LED's in my mix. Still, on study of the plot above, I must note that the Germanium characteristic at 0.5 to 1.0 uA appears to be curving towards its zero-crossing. Perhaps targeting an amp range between 3.0 and 5.0 uA would have been better, still thinking here, on va voir....
Shockley equation Id = Is*{exp[(qe/(n*k*T))*(V-I*Rs)]-1}
where:
n = ideality factor
Is = Saturation current in Amps
Id = Diode Current in Amps
Vd = Diode Voltage
k = boltzmann = 1.38E-23 J/K
T = temp K = 300
K = dC + 273.15 Kelvin
qe = electron charge = 1.609E-19 cmb
Often simplified to:
Id = Is*(exp(Vd/(0.0256789*n))-1)
Diode Resistance Ro = VT * n / Is
Where:
T = 300K
VT = k*T/qe = 0.0256789
SO: Ro = k * T / qe * n / Is
Ebers-Moll equation Vf = m (kTq) ln [(If / Is) +1]
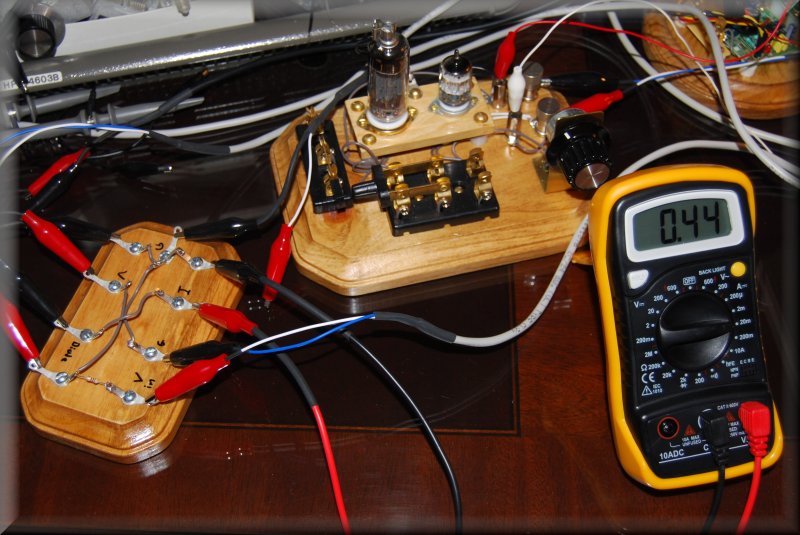
Photo of the lab with my diode test jig, amp meter, and diode vacuum tubes under test.
