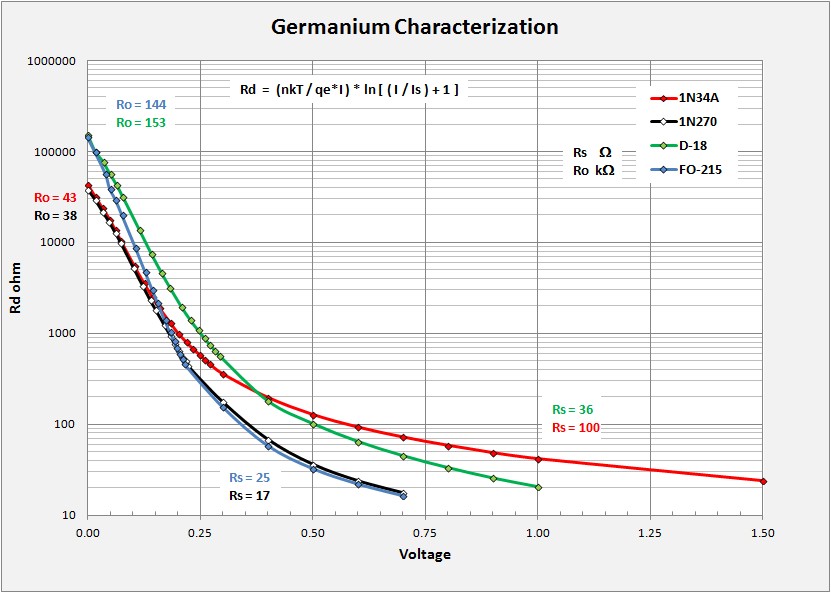
A typical diode consists of two electrodes, one with a small spring or "cat's whisker" of tungsten or gold attached and the other holding a small pellet of ultra-pure germanium. The germanium crystal had a minute amount of impurities giving the pellet an N-type property. All this hermetically sealed into a small glass enclosure. With the whisker pressed against the n-type germanium a relatively large current is pulsed "forming" in the pellet a very small hemispherical region of p-type alloy. From the forming process results a small P-N junction. Once formed, the whisker itself serves only as an electrode in point contact with one side of the junction. Because of its small size, the junction has low capacitance and may be readily used for high-frequency applications. The physics of the P-N junction is beyond the scope of this note and way beyond my expertise.
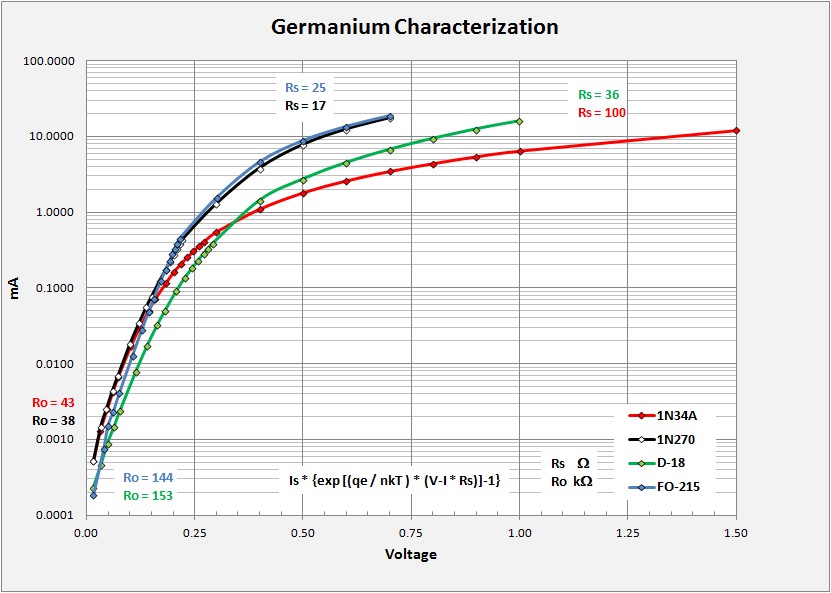
A better way to present the same data is with the Current axis on a logarithmic scale. The log scale expands the low-current portions of the curve without losing the higher current data making relations easily visible over the entire forward-biased portion of the curve. For diodes the I/V curves pass through the plot origin at zero bias voltage = zero current so on this plot the curves converge towards the origin. Note also, by using the absolute value of the current at negative voltage bias allows a full view including measurements at reverse voltage. Just remember to drop the 0/0 point at the origin or the spreadsheet program will be unhappy to make a log current scale.
The data used to make these curves are from a collaborative effort by myself and Mike Tuggle. Mike performs high-precision measurements over very low current and voltages. This allows him to determine the parameters n and Is with excellent accuracy. His setup typically does not allow measurements much above 0.025 volts although for this exercise he modified his bench to allow measurements as high as 0.27V or so. My own setup does not have the precision of Mike's, but produces good data out to 2.0 Volts. Together we were able to splice together data on four typical but interesting diodes and produce a complete evaluation over a wide I/V range.
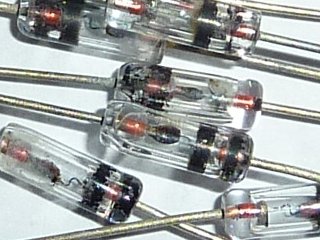
Each plot further includes the determined parameters of Ro (zero-bias resistance) and Rs (series resistance) of each diode. The diodes chosen, 1N34A, 1N270, FO-215 and D-18 provide an interesting set of I/V curves that well illustrate a broad range of germanium behaviors. The diodes 1N34A and 1N270 are common diodes used in many crystal radios. The 1N34A has a tungsten whisker though while the 1N270 has one of fine gold. Both of these diodes are characterized by relatively low zero-crossing Ro, near 40 kohms. This limits their use in a crystal set unless tapped low on the tank coil. Series resistance Rs for the 1N34A is also high, at 100 ohms while the 1N270 is less than 20 ohms.
Diodes FO-215 and D-18 both have high Ro in the vicinity of 150 kohms making these excellent choice diodes for most crystal radio use. The FO-215 with its gold whisker has an Rs of about 25 while the D-18 with its tungsten whisker has a somewhat higher Rs of 36. If we consider the 1N34A a typical low-end diode and the FO-215 as the "Holy Grail" then the 1N270 and D-18 are each a bit hybrid. The 1N270 shares the low Rs of the FO-215 but also the low Ro of the 1N34A. The D-18 shares the high Ro of the FO-215 but the larger (kinda) Rs more similar to the 1N34A. Together these four diodes illustrate many, possibly most of the variety one will encounter in germanium diodes.
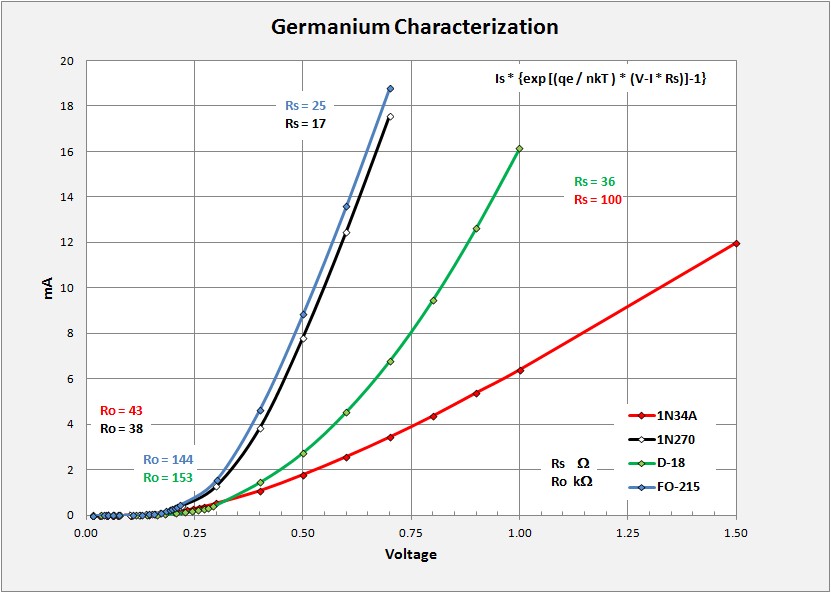
Finally, the following plot gives logRd versus voltage. Rd, the dynamic resistance is what we wish to think of when looking at diode behavior. Here the curves intersect the Y voltage axis at their Ro value rather than converging to zero as they do on the traditional I/V plot. I consider this the definitive plot for a diode's characteristic.
With this view of the characteristics for the four diodes in question, I wish to point out the curve for the FO-215. Ro for the diode is a great 144 kohm. You will also note the fine Ro = 153 for the Russian D-18. Still, look at the curves, not only the Ro point. The FO-215 has by far the steepest log Rd versys V of all tested diodes. The D-18 while having a high Ro, has a slope generally parallel to the 1N270 or 1N34A. Rectification does not follow simply from the resistance, (or we would just use a resistor) but the variability in the resistance. A high Ro is desired to best match the diode to the tank and load, but does not a guarentee of greatest sensitivity. The value of "n" (the slope of the curve) needs also to be considered.
I have been attempting to get a handle on the main diode parameters Is, n, and Ro and how they impact the operation of a crystal radio. My method of choice is to use a graphical approach, plotting charts where variations between plotted parameters become apparent and easy to visualize. I have developed an interesting chart from the measurements above that compares many diodes with respect to Is, n, and Ro, and to understand how this fits into a matching situation with a fuzzy indication of typical tank impedance limits.
Ultimately one seeks a diode with an Rd that matches with and conjugate to the impedance it sees from the tank (+antenna). In the following discussions I will start with the cross-plot of Is to Rd and then proceed to a look at how received RF power plays a part in the selection and why low Is and n are desired.
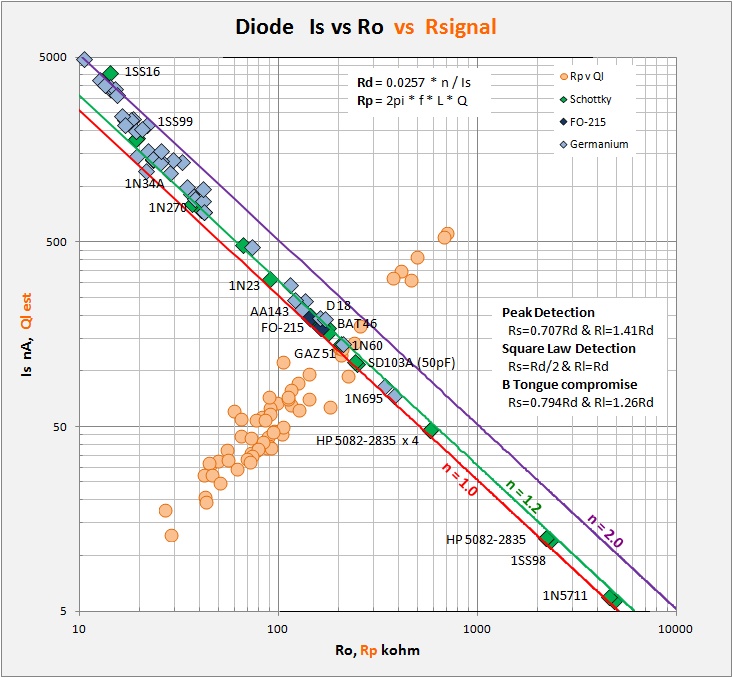
The plot above shows the relationship between diode Is and Ro. Ro is calculated via the equation Ro = VT * n / Is where VT is the thermal voltage = k * T / q = 0.0257V at room temperature and Is and n are from the measured diodes. k is Boltzmann's constant = 1.38E-23 J/K and q is the electron charge = 1.609E-19 coulombs. On such a plot I can show lines of constant n, and plot the values for individual diodes for which I have spent considerable effort to determine the parameters Is, n and Ro (where Is is the diode saturation current, n is the ideality factor, and Ro is the diode resistance at zero bias). On the plot it should be evident how changes in n or Is impact a diodes' Ro.
Additionally I have plotted RF signal parallel resistance Rp as orange circles from published coil unloaded Q (see my section on Coil Q). To convert from Qu to Ql I have made the assumption that loaded Q is about 1/6 unloaded Q for low-end sets while in performance sets it may approach 1/2.5 the unloaded Q. This is only an estimate then, but starting from actual data. To make the conversion to Rp I simply plugged the data into the standard equation R = 2pi*f*L*Q using a scaling factor to divide down Qu to Ql from high Q (1400/2.5) to low Q (100/6). This provides a nice visual display of the expected range for Rp in many crystal sets. I plot the Rp against the value of Ql used. Note that these data are for the case at about 1MHz and inductances between 200 and 300uH, as published.
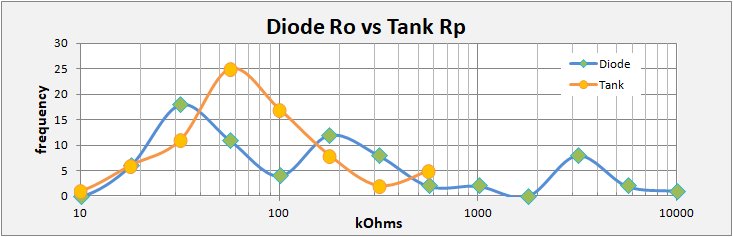
Note in the lower plot I make data-frequency histograms for the Diode Ro and the loaded Tank Rp. Hopefully this demonstrates the matching overlap more clearly than in the upper plot, although the same data is used in both.
Matching the diode to the tank is a matter of finding a diode with both sensitive qualities (low n) and an Ro close to the Rp presented to the diode (as per Ben Tongue's suggestions for Peak and Square Law detection). Those diodes with Is's in the 100 - 250 nA (100-280 kohm for n=1.1) or so range have the possibility to match while connected to the top of the tank coil without the use of Q-lowering taps, while untapped matching to high-end high-performance big-Litz baskets will require diodes with Is's in the 35 - 60 nA (500-800 kohm for n=1.1) range. Most "typical" germanium diodes have high Is values (>500, >60kohm) and will require a tap. Diodes such as FO-215, BAT 46, 1N60 and GAZ51 can be matched to many tanks without taps. For tanks with high quality Litz coils one will be using HP 5082-2835 or 1SS98 diodes, generally 3 to 4 in parallel to lower the Rd to the desired range. (Curiously, I have not found any diodes with Rd values in the 300 to 4500 kohm range.) Note that both resistance and impedance are frequency-specific so a match at one frequency will not remain matched across the broadcast band.
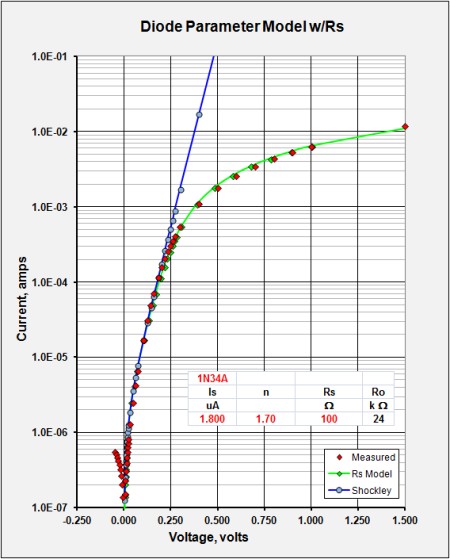
Finally, the Current/Voltage characteristic curve data can be used to determine the series resistance Rs of the diode with proper modeling. Mike Tuggle has worked out an Excel spreadsheet where he uses Solver to extract the best-fit n, Is, and Rs parameters. With the large impact of Rs at voltages above 0.3 or so, the fitting algorithm << Vcalc = (nkT/q) * ln [(Iobs /Is) + 1] + Iobs * Rs >> will tend to overestimate the values n and Is. Still, it provides a better overall view of the diode response to the full spectrum of voltages. Naturally, for weak signal work, using the more detail algorithms presented above is the proper method and in this page I report n and Is only where determined at low voltages. The plot below gives a full evaluation for a 1N34A diode out to 1.5V with observed data in red, shockley ideal model in blue, and the Rs model in green. Note that for negative voltages I have used the absolute value (positive) for the current in order to plot the Current axis with a logarithmic scale. This accounts for the small "tail" at negative voltages.
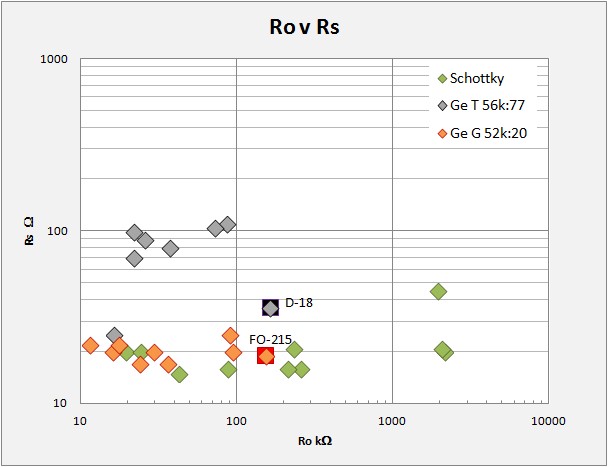
The following plot compares Ro to Rs for the germanium and schottky diodes presented in the following page. Schottky diodes generally have lower Rs and higher Ro than germanium and more and more are finding a prominent place in crystal sets. For Germanium diodes I have distinguished those with a gold whisker (Ge G) from those with tungsten whiskers (Ge T). Both types appear to exist over a broad range of Ro's but, with a couple exceptions, gold whiskered Ge diodes have significantly lower series resistance Rs. What in the fabrication process actually controls Ro remains unclear. P and N carrier density is implicated, but what is done to control this?.

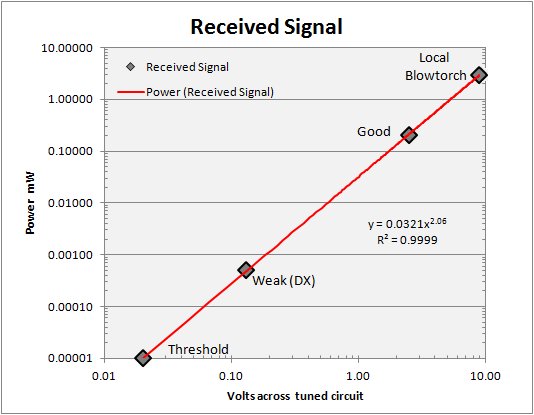 Here is an interesting plot taken from the text discussion in "Crystal Set Analysis" by Berthold Bosch. It presents received signal strength across the tuned circuit for various scenarios from threshold audibility to local blowtorch. This plot should be considered a single example specific to his location and antenna/ground system. In the text he describes his antenna an inverted L 43m long (140') and 10m high (32'), an excellent antenna most of us do not have the real estate to erect, but offsetting this is a poor ground with Rg = 210ohms. Given the offsetting conditions I would imagine this is a good generic example of what received signal voltage and power levels presented across the LC circuit to the diode are likely to be. Bosch cited 40nV as the threshold of audible detectability (impedance matched conditions with 16kohm RF impedance / 4kohm DC phones) and for this plot I pushed it back to 20nV as it gave a superior regression fit.
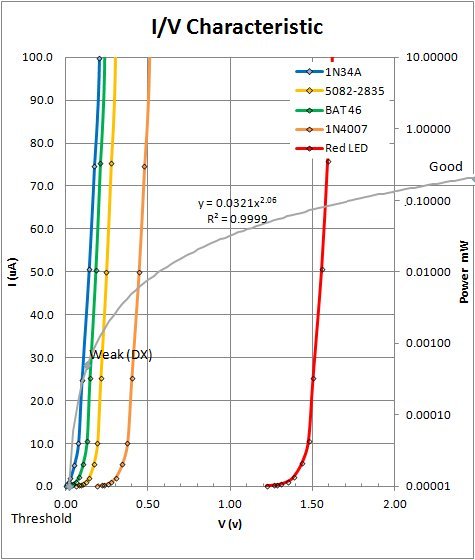 This plot at left takes some actual diode I/V measurements rather than the models presented below and plots them along with the above RF voltage across the LC circuit versus RF power in mW. Here one sees that pushing for very very low Vf (via high Is / low n combinations) pushes the limit of detectable signal power from the antenna. At such minute power levels I imagine the reverse leakage current becomes significant and probably offsets the low operating point gains sought.
Kevin
Diode				n	Is	Rd
					nA	k Ohm
Germanium Diodes
FO-215		ITT		1.11	175	163
FO-215		ITT		1.10	196	144
1N277		black		1.50	2293	17
1N277		black		1.60	2296	18
1N270		bonafide	1.28	915	36
1N270		blue		1.26	857	38
1N270		blue		1.66	2310	19
D18		russia		1.20	194	160
D18		russia		1.27	193	170
GAZ 51		Tesla		1.14	140	211
GAZ 51		Tesla		1.52	617	64
OA 5		Tesla		1.85	3384	14
OA 5		Tesla		1.48	1996	19
D9E		russia		1.42	2161	17
D9E		russia		1.54	2414	16
1N34A		bonafide	1.82	2153	22
1N34A		bonafide	1.25	1392	23
1N34A		green		1.57	1389	29
1N34A		green		1.30	1185	28
1N34A		green		1.32	1554	22
1N34A 37	orange		1.10	1458	19
1N34A 37	orange		1.36	1370	26
1N34A		red		1.34	833	42
1N34A		red		1.32	993	34
D310		russia		1.01	1215	21
GD 402A		russia		1.55	970	41
GD 402A		russia		1.71	1360	33
UK A		russia		1.56	1565	26
UK A		russia		2.00	5766	9
UK B red	russia		1.64	2049	21
UK B red	russia		1.85	3777	13
UK C ora	russia		1.92	3462	14
UK C ora	russia		1.95	3354	15
UK D blk	russia		2.00	4901	10
UK E blk	russia		2.00	5862	9
UK F blk	russia		1.82	3523	13
UK G blue	russia		1.86	3123	15

Average				1.39	1334	54


Schottky Diodes
HP 5082-2835			1.07	12	2206
1N5711		blue		1.07	6	4541
1N5711		blue		1.07	6	4816
1N60				1.09	178	158
1N60				1.10	161	176
BAT 46				1.12	141	204
BAT 46				1.18	172	177
1N34A ?		schottky	1.11	317	90
1N34A ?		schottky	1.24	482	66
1N5819				1.19	750	41
1N5819				1.14	807	36
1SS16
1SS16

Average				1.13	276	1137


Silicon Diodes
1N914				1.95	5	9293
1N914				2.02	7	7618
1N4148				2.00	6	8934
1N4148				2.00	6	9323
1N4007				1.51	1	64311
1N4007				1.51	1	77954
6A10				1.57	2	19275
6A10				1.54	2	20379
1N4736A		Zener		1.15	0	1.91E+09
1N4736A		Zener		1.14	0	2.50E+09
KB 130		russian		1.14	0	5.83E+08
KB 130		russian		1.16	0	4.36E+08
UK H		russian		1.94	8	6263
UK H		russian		1.77	4	12548
UK I		russian		1.78	0	260253
KD 401A		russian		1.51	0	232930
KD 401A		russian		1.38	0	1539619
D 220		russian		1.26	0	322405
D 220		russian		1.24	0	537707
D 223A		russian		1.20	0	10262661
D 223A		russian		1.20	0	8565213
UK J		russian		1.46	4	9849
UK J		russian		1.40	2	20013

Average				1.52	2	2.37E+08


Light Emitting Diodes
Red				2.15	0	1.70E+12
Red				2.07	0	5.52E+12
Amber				1.56	0	2.09E+17
Amber				1.62	0	6.46E+16
Yellow				1.59	0	8.03E+17
Yellow				1.38	0	2.87E+20
Green				2.05	0	4.23E+13
Green				2.07	0	4.34E+13
Water Green			3.27	0	4.85E+13
Water Green			1.93	0	5.79E+19
White-Gn			1.44	0	1.05E+20
White-Gn			3.04	0	6.88E+09

Average				2.01	0	3.76E+19