This project is fairly intensive equipment-wise and it is the only geophysical project undertaken with a significant investment in soldering things together. Measuring the geomagnetic field is no easy task as the signal is small. The best way to go about this is to acquire a small fluxgate magnetometer and there are a number of hobby-type models available. I was hoping to measure the field on all three axes and the prospect of buying three magnetometers and wiring the whole shebang together was daunting. I opted instead to shell out a few shekels and buy a proper three-axis navigation fluxgate device. I chose a small low-noise unit manufactured by Applied Physics Systems, their Model 113 "PC Board-Level 3-Axis Fluxgate magnetometer".
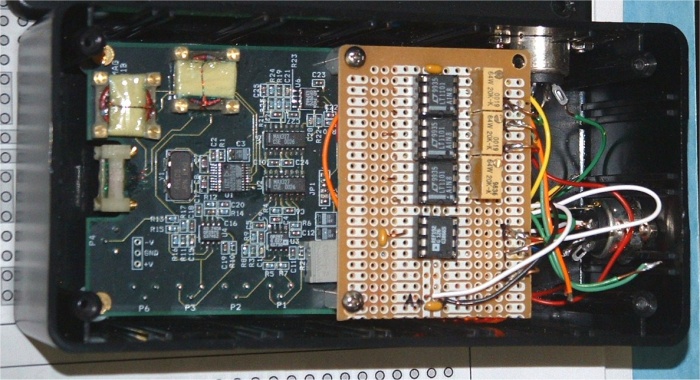
While this saved me a lot of time and headache, there remained significant engineering to get this to perform as a low-noise earth field instrument. The Model 113 is a navigation instrument and is designed to output a +- 4.0 V DC voltage for a full 360 degree rotation about all three axes. A field monitor does not require this as the instrument remains stationary. Field variations only offer a minuscule delta and require amplification in order to register. For this I required very stable and low-noise amplification. The instrument photograph at the bottom of this page shows the completed magnetometer with the Model 113 on the left and the amplification electronics to the right. Any proper engineer who happens to be looking at this is most likely howling with laughter right now, and with good reason! More on this in a bit.
To keep the amplification constant and low-noise I used three (one for each axis) instrumentation amplifiers, Linear Technology LT1101. These provide a precision fixed gain of 100x. I also used an Analog Devices REF192 voltage reference to avoid drift due to local power variations. With this amplification I am able to measure small field variations. Finally, I added three (admittedly cheap) trim potentiometers to bias the output to within the analog-to-digital logging instrument. My idea in housing all this into the same box is that the pots would be "set and forget". It is a fatal flaw in the design and drift is present and it is nearly impossible to adjust the pots with the magnetometer right there. Any tinkering with a screwdriver alters the field around the magnetometer. Advice to anyone attempting such a project, keep the 3-axis magnetometer isolated from all other electronics!
A few background notes on the nature and goals for the project. My intent is to detect and measure variations in the earth's magnetic field. Variations occur on many scales from long-term secular displacements in the location of the poles to daily, hourly (and smaller) variations caused by interactions between the geomagnetic field and the solar wind. Effectively, I am trying to monitor the earth/sun environment.
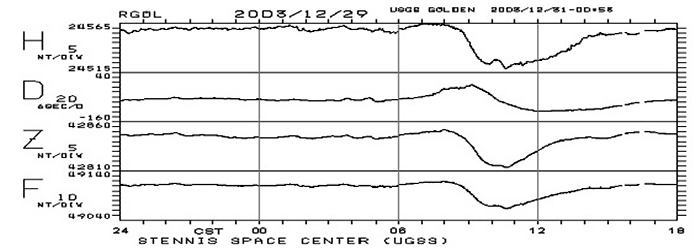
The diagrams above show magnetic variations on a "quiet" day, 20 Dec, 2003. Curves are labeled H, D, Z, and F. These represent the Horizontal field (in nt nanoteslas), Declination in degrees from true north of H, the vertical downward component, and the total Field F along that vector. These components are calculated from field measurements made at NS (X), EW (Y), and Vertical (Z) orientations.
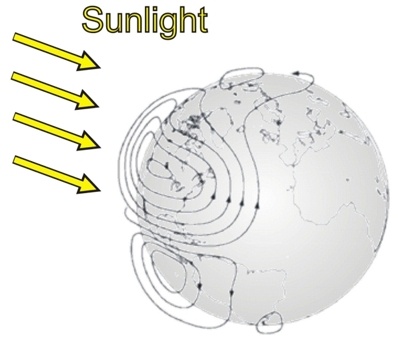
The variations seen in the Stennis record result from induced currents as sunlight ionizes and heats the ionosphere. As the earth rotates beneath these currents a magnetic field sine pattern is superimposed on the steady field. These variations were my first goal and as can be seen in my records below for the same day the instrument is fully functional.
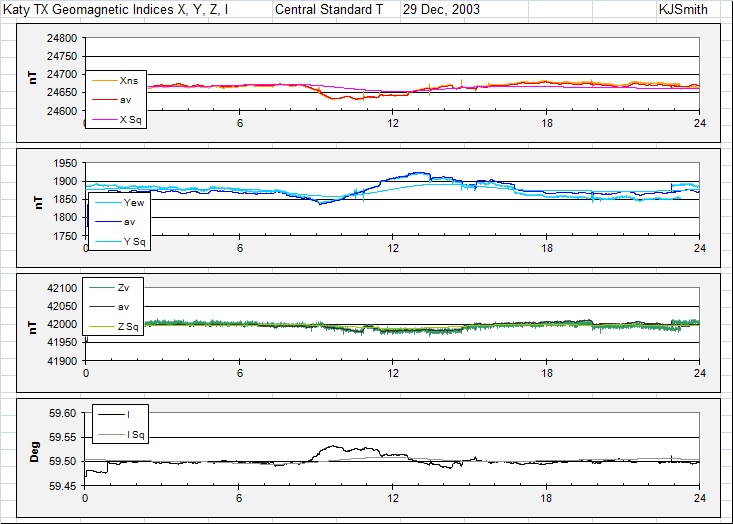
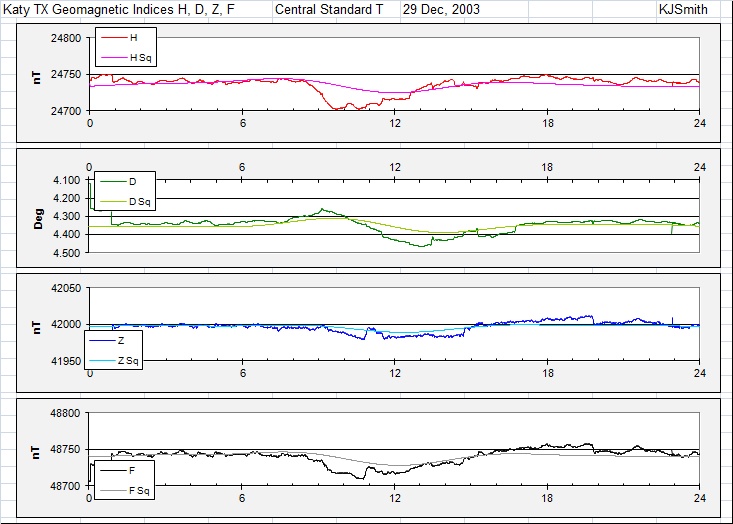
My plots provide both X, Y, Z, and I (intensity), but also the H, D, Z, and F parameters. X, Y, and Z are recorded by the magnetometer and all others are calculated. Stennis Observatory is located in costal Mississippi and is the station most nearly proximate to my station in Katy, Texas. My charts are in CST while those from Stennis are in UT which should explain the time offset between features seen in the respective curves. I also include smooth calculated Sq variations with my curves, the expected "ideal". No day is ever ideal!
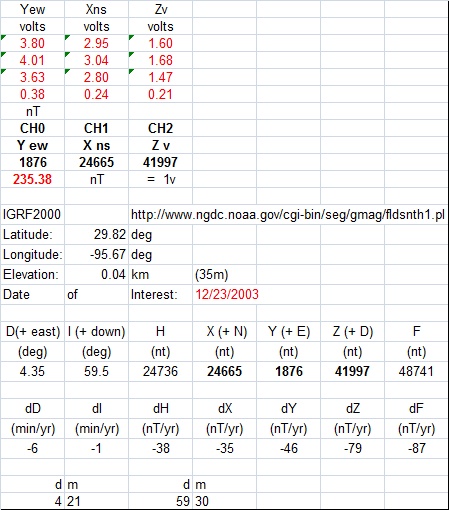
I used Stennis data to calibrate my AD output readings and convert them into nanoteslas. With amplification on such a small signal, there is considerable noise to contend with. The noise appears random and I beat it down by taking one sample each 6 minutes and sampling the magnetometer 15 times a second. That equates to an averaging of 5400 readings for each sample.
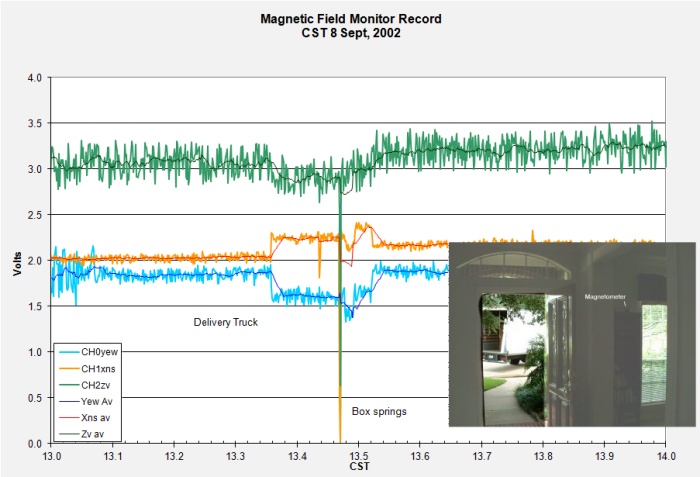
The magnetometer is highly sensitive and tracks many things besides the geomagnetic field. When cars drive past the house or someone parks their car nearby it registers on the curve as a DC shift, temporary if driving by, permanent if parked. During one run we had a set of box-springs delivered to the house. The whole event is shown on the above chart. The truck caused a noticeable deviation on the daily curve while, as the springs were carried up the stairs above the meter the readings went off the chart! This ought not be a surprise, what are the springs other than a set of a zillion induction coils? Conspiracy theorists ought to have a field day with this one, and then go out and get one of those foam mattresses.
Drift in the instrument proved to be my downfall. It needed adjustments almost weekly, hardly set and forget. I have yet to make the needed mods to get things running again, but plan to, when the spirit moves...
Geomagnetism directly touches the Sun-Earth connection, next we visit their induced children, Telluric currents.